Spot the problem.
Keep the context.
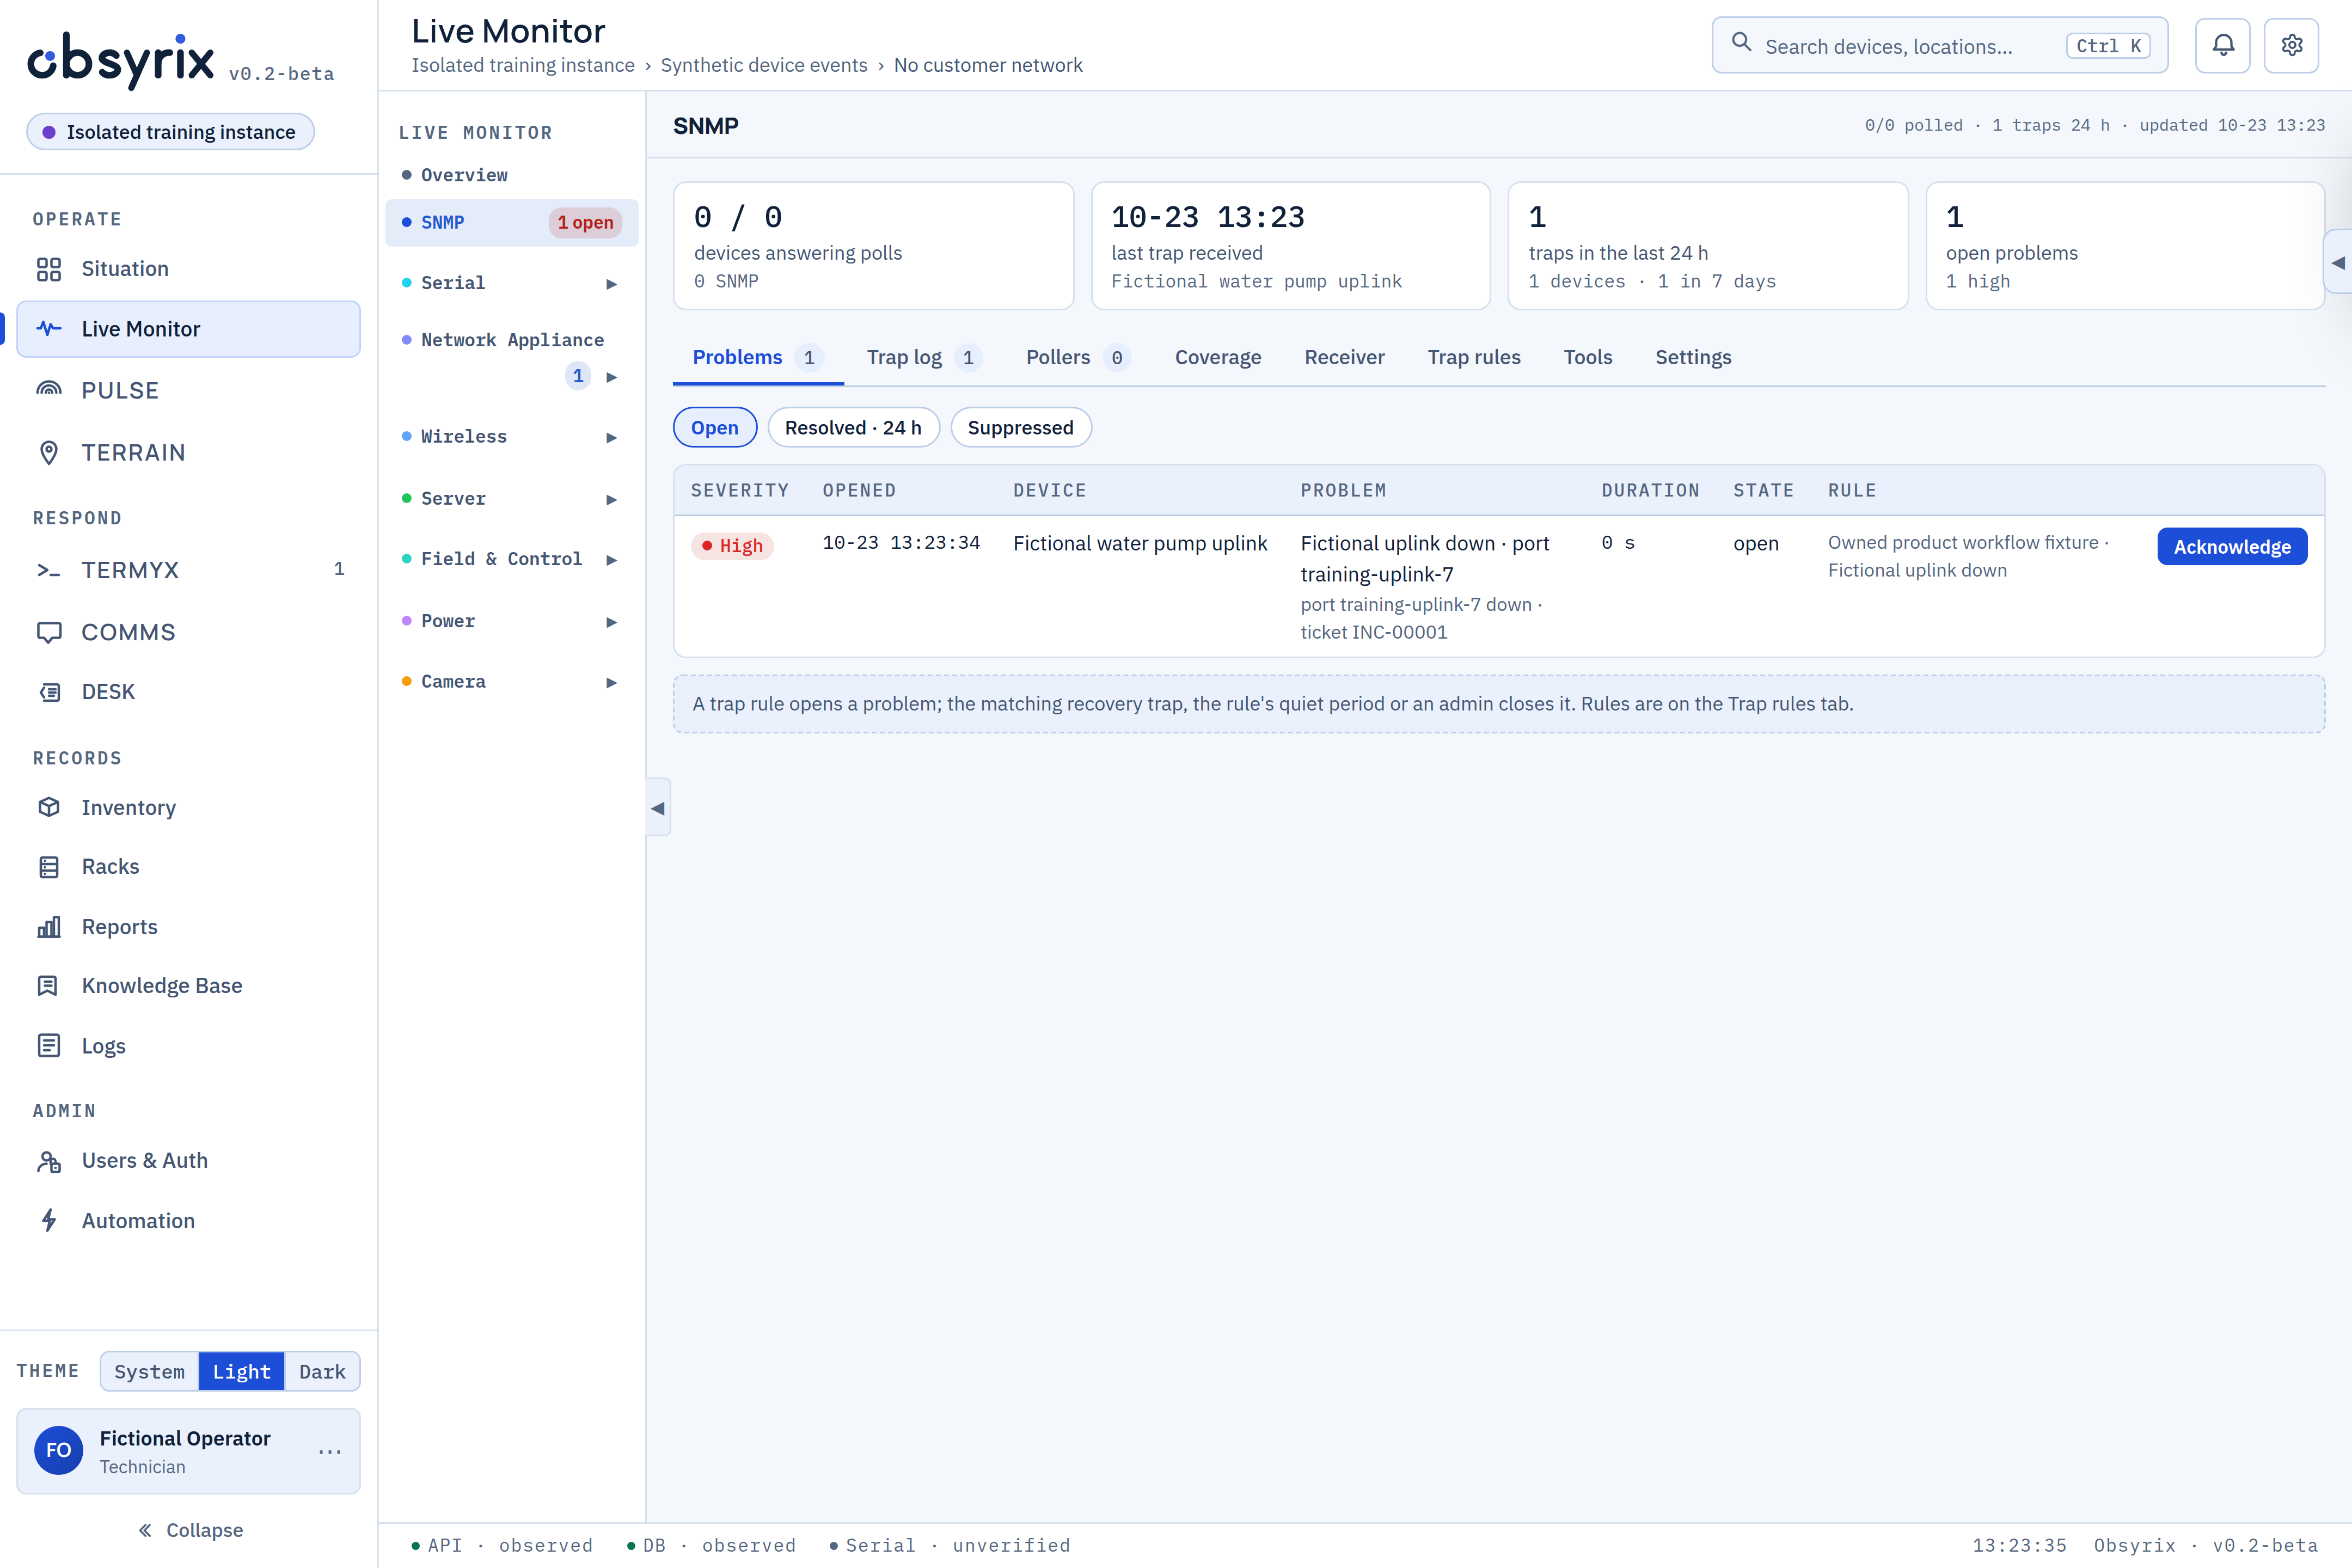
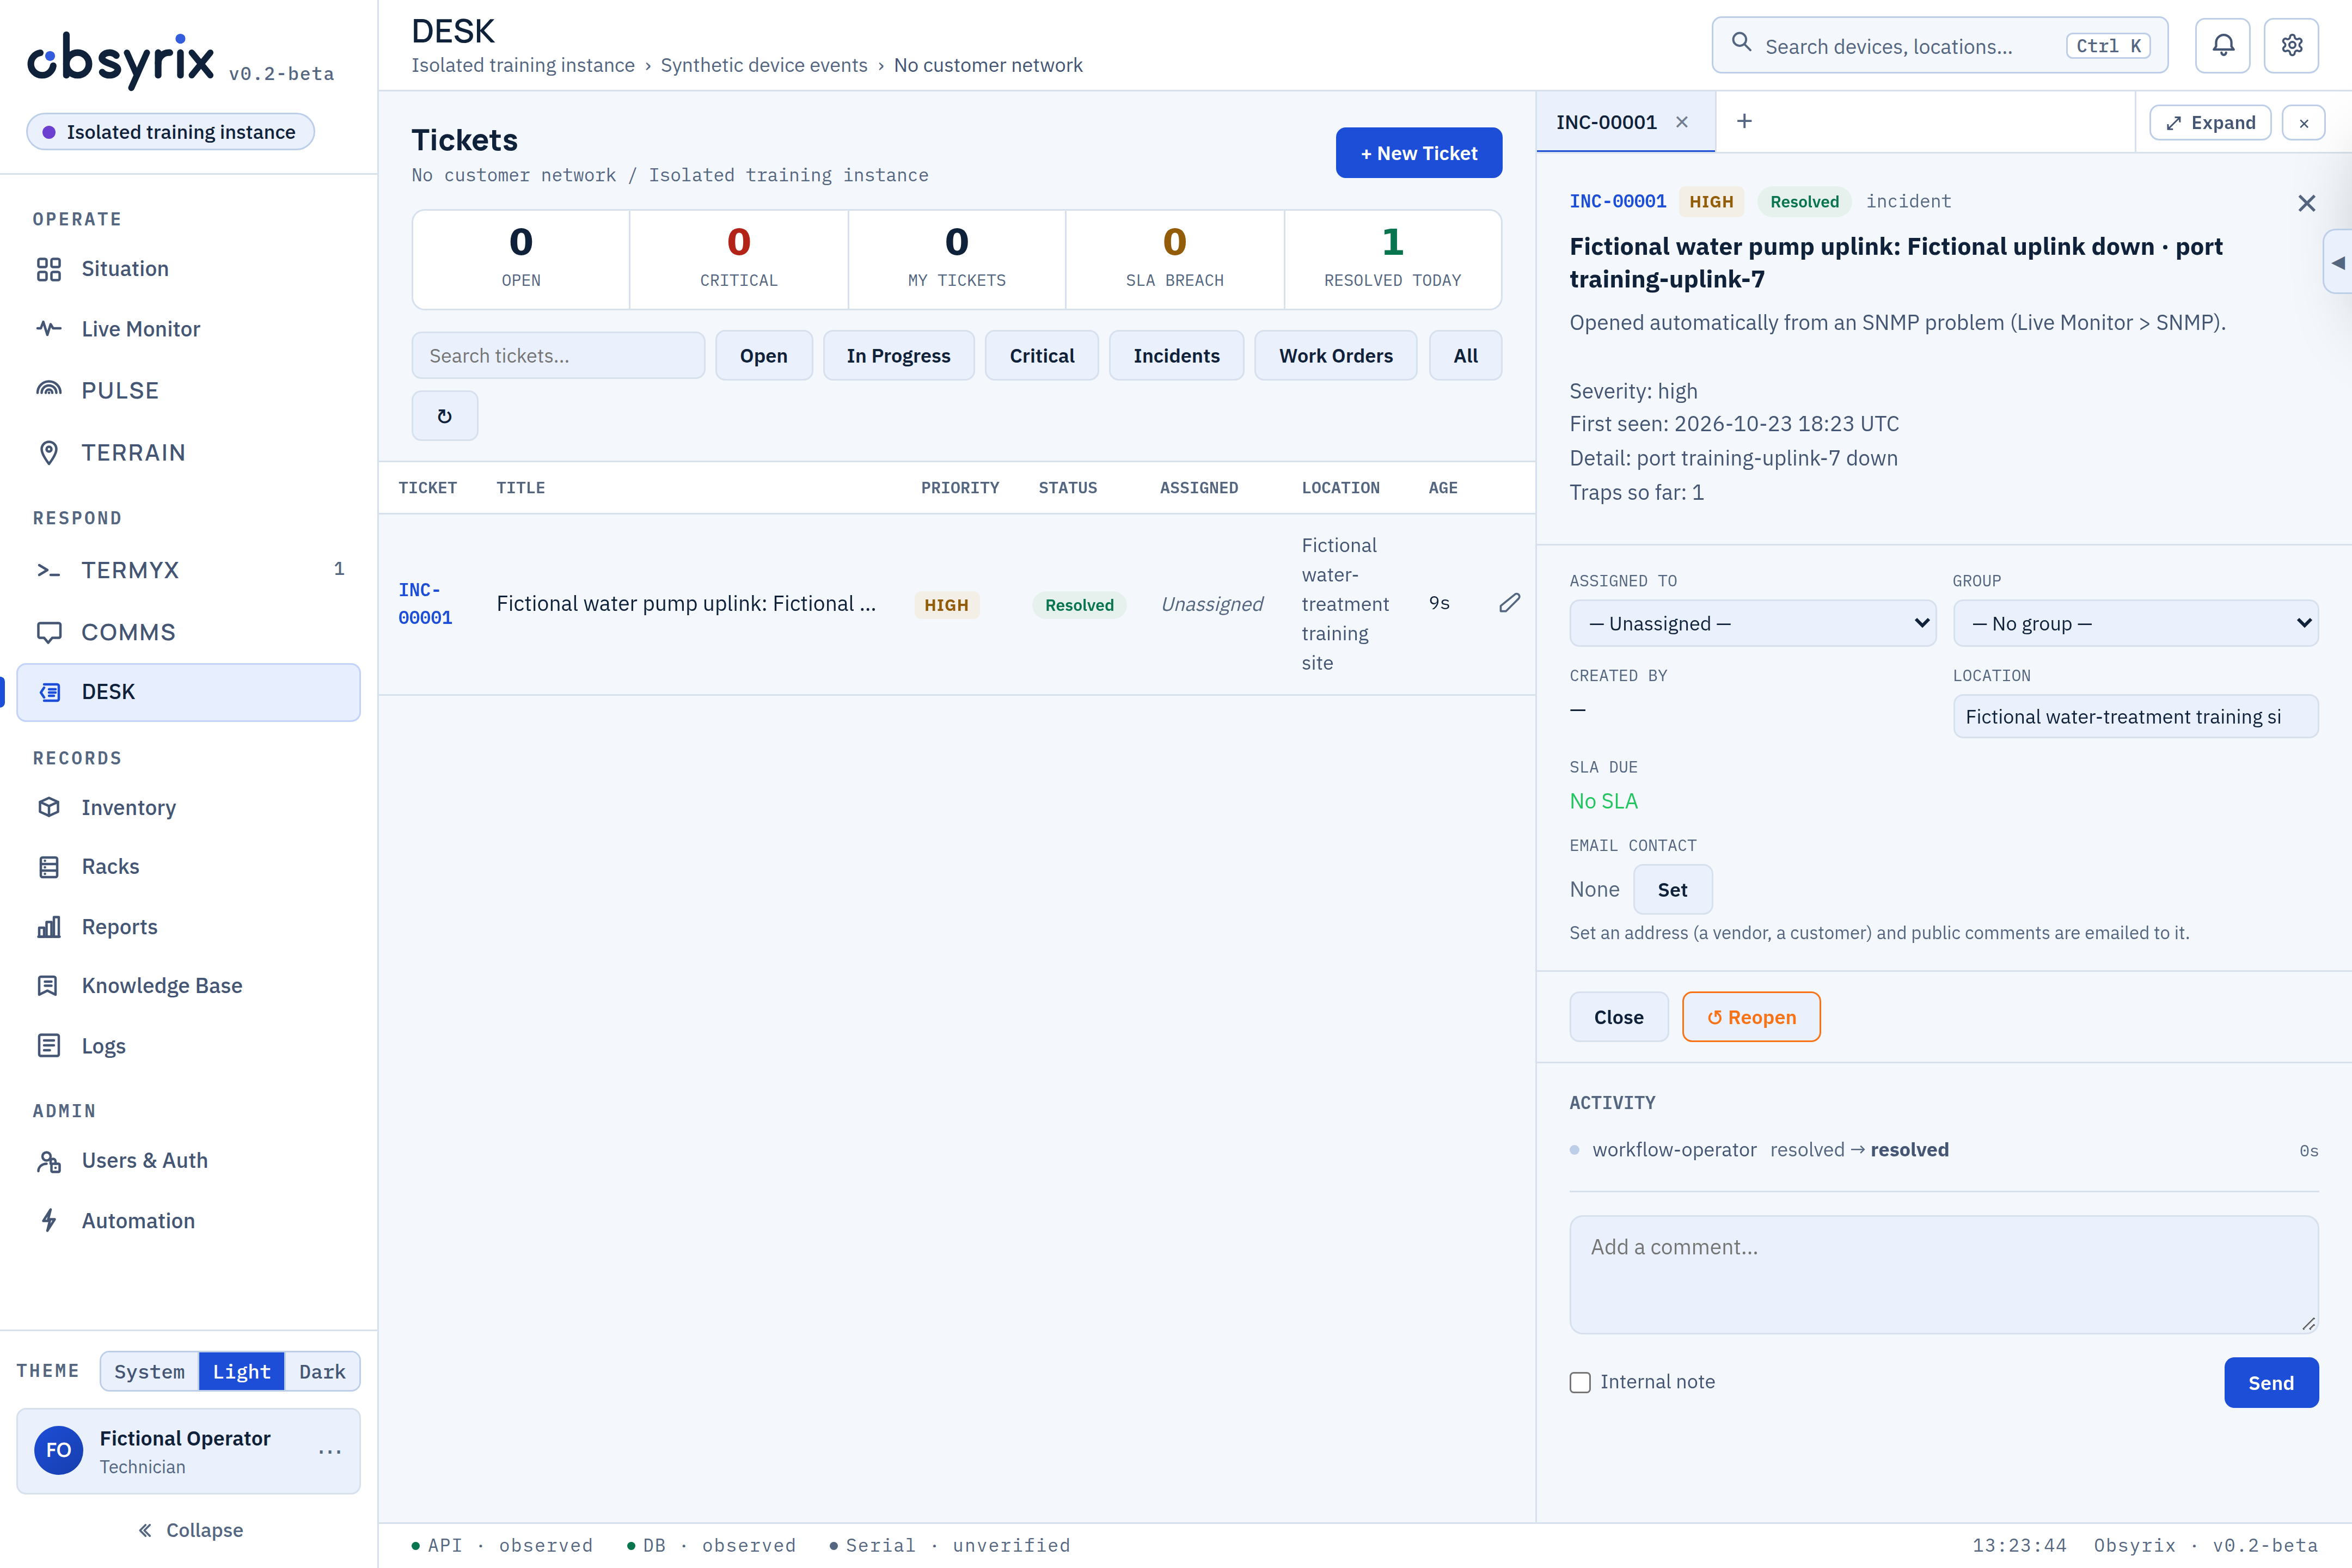
A fictional uplink-down event appears as a high-severity SNMP problem, already linked to its incident.
A signal with somewhere to go.
Even the serial ones.
Obsyrix puts your controllers, RTUs, switches, radios, servers and HMIs in one directory, whoever made them, then opens any of them in a browser tab, over serial, SSH, Telnet, RDP or VNC. It finds what's on your network, watches it, and runs on your own hardware.
Obsyrix talks standard protocols, so it works with the gear you already own, whatever the badge on the front says. No vendor plug-ins to buy, nothing to rip and replace, no lock-in.
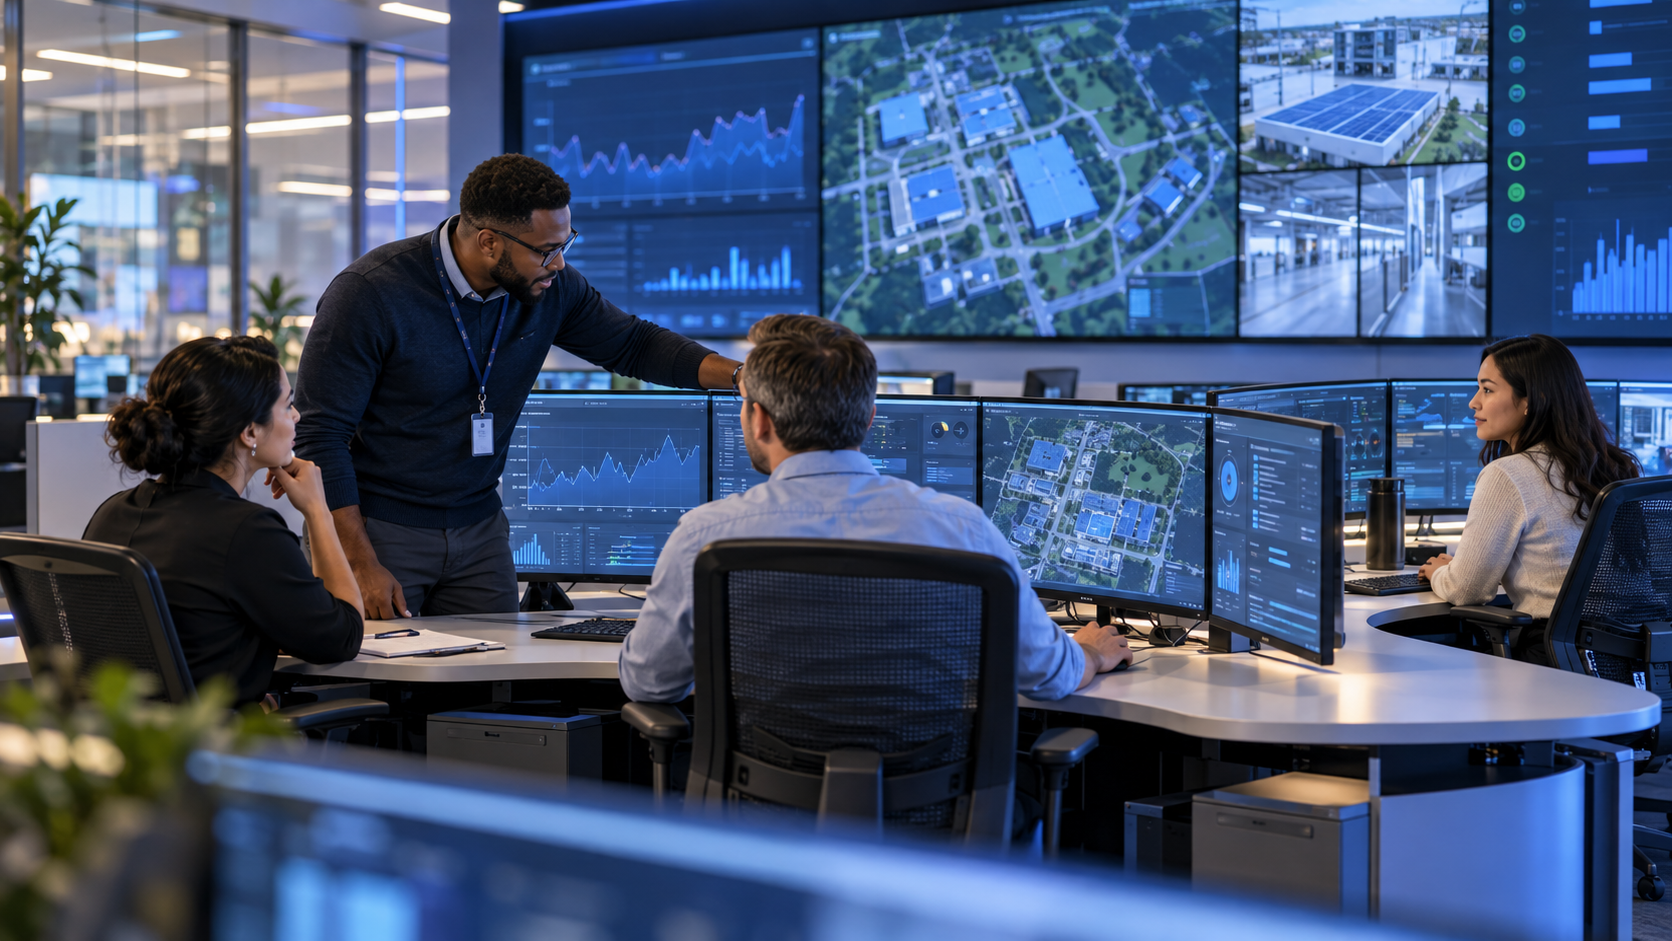
One workspace for the control room, the service desk and the engineer in the field.
AI-generated illustrative scene.
Follow one incident across monitoring, service desk and team conversation. A guided look at the real workspace, with fictional training data.
A fictional uplink-down event appears as a high-severity SNMP problem, already linked to its incident.
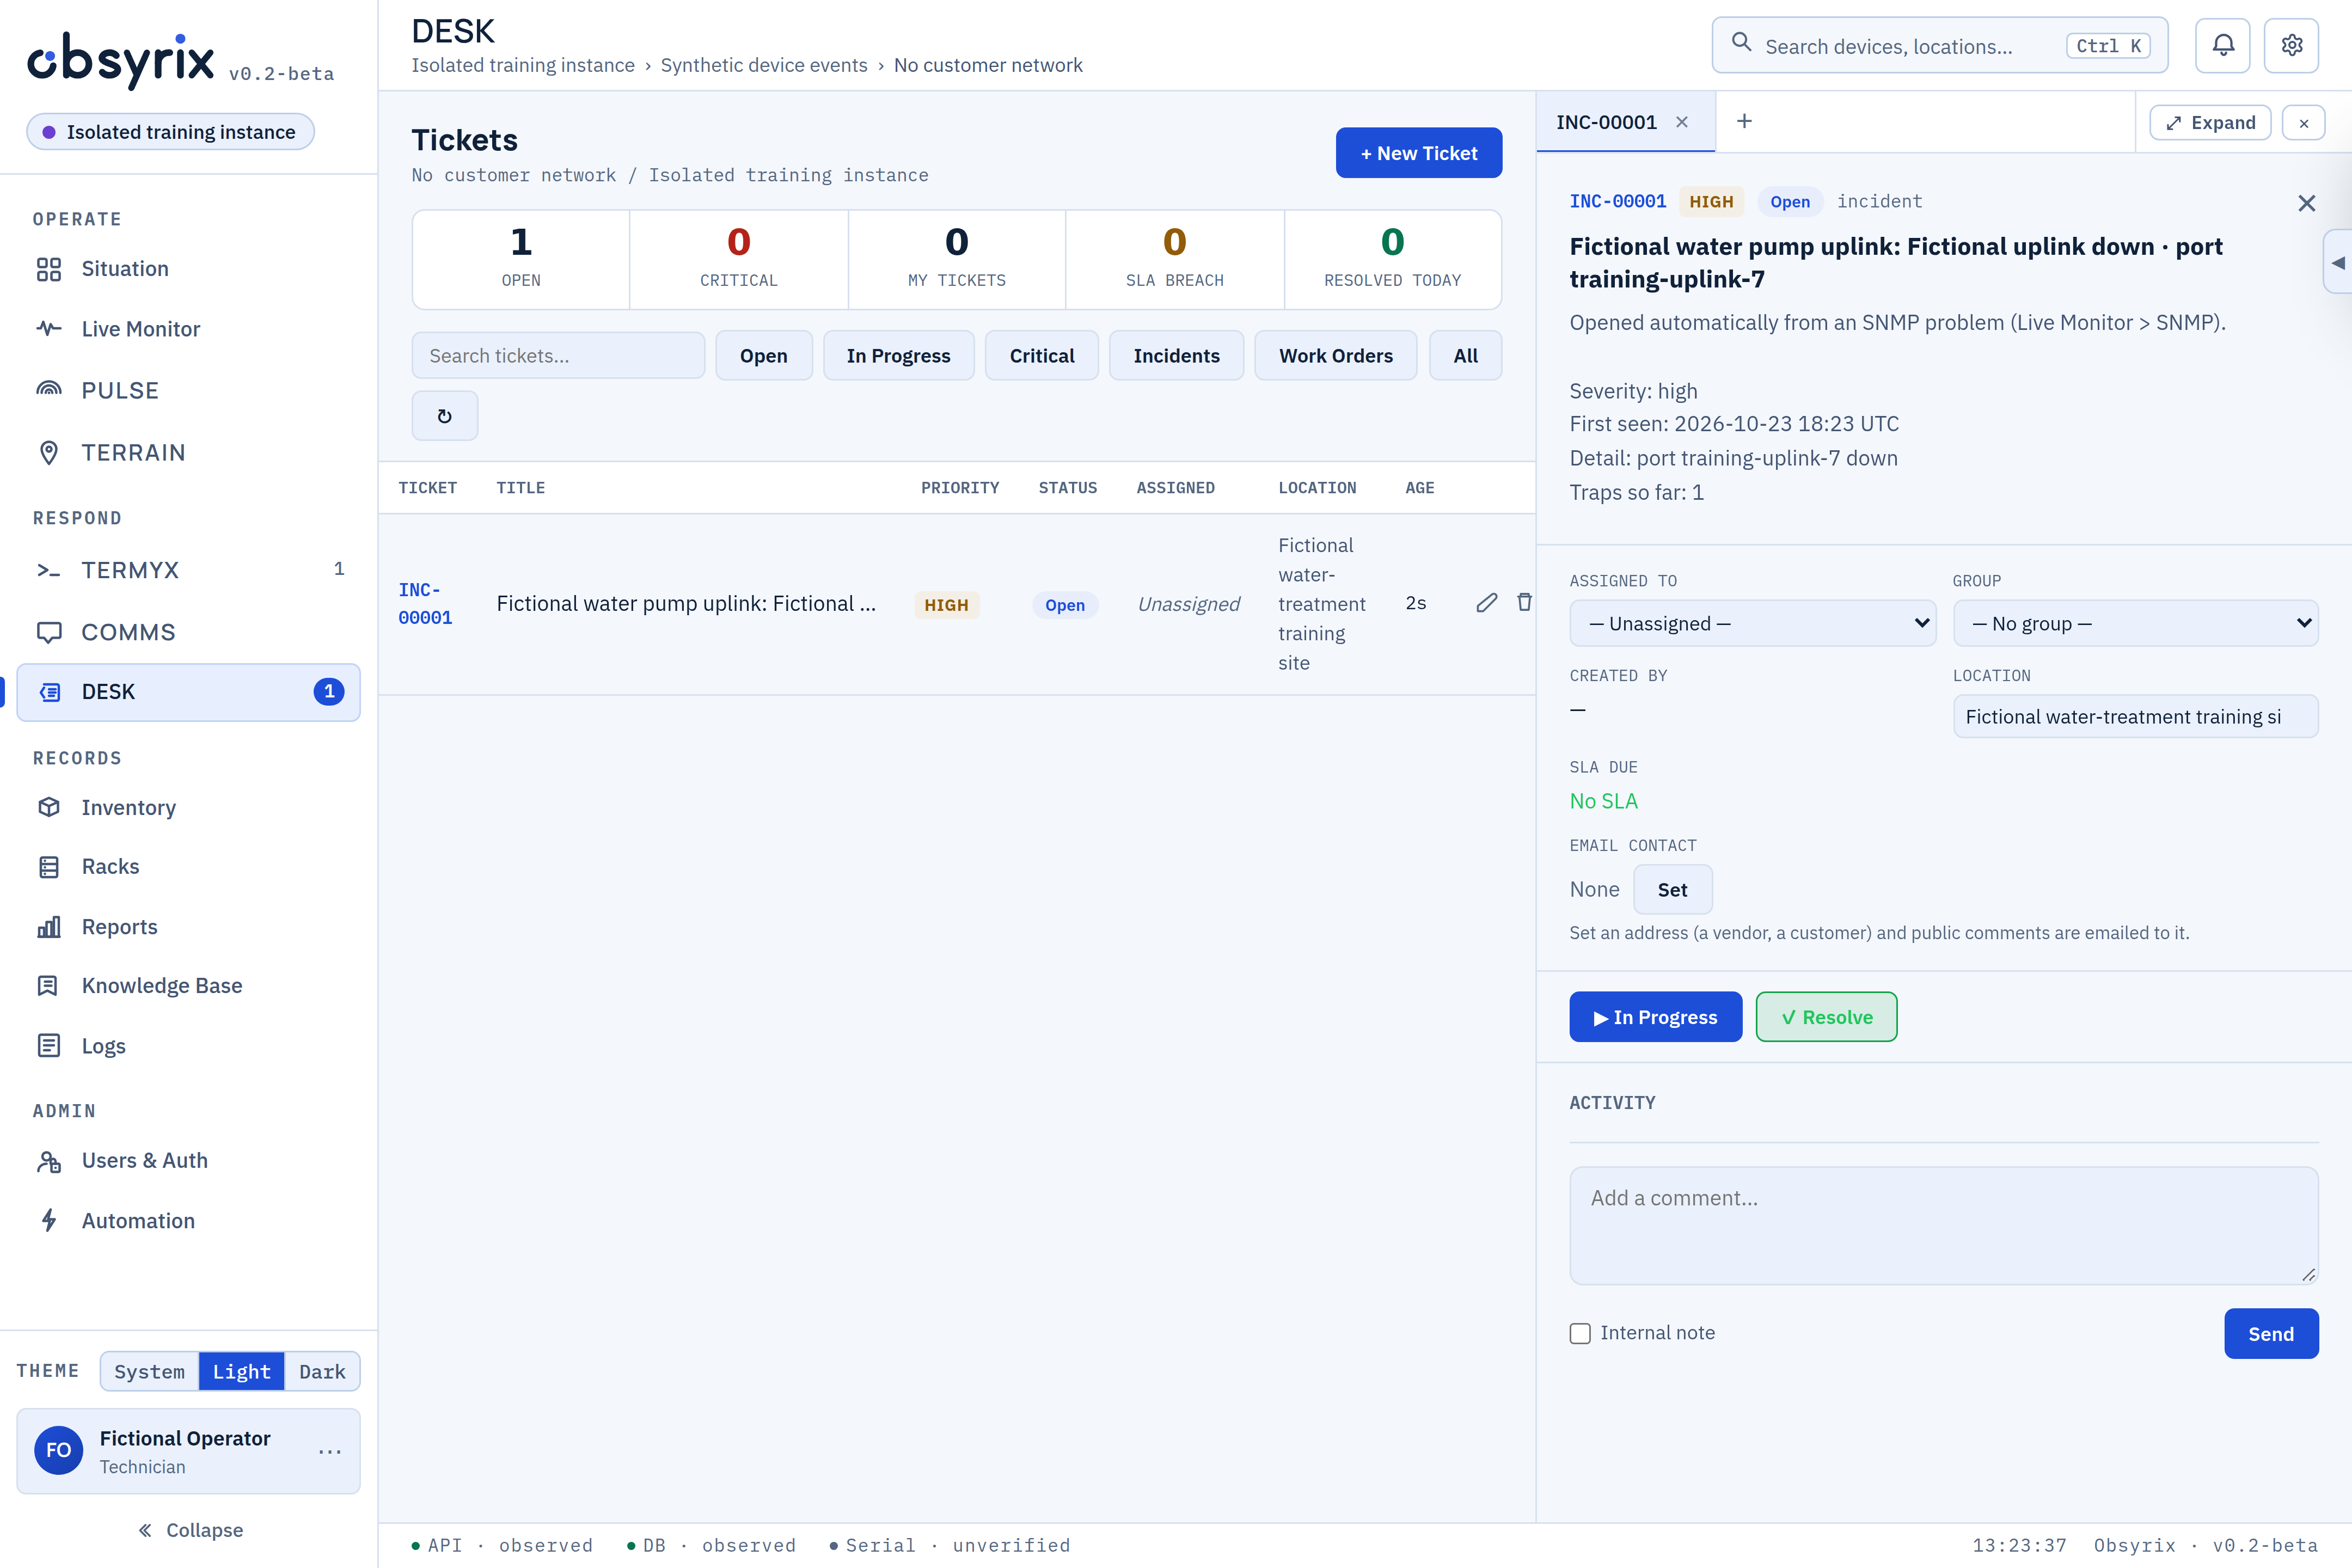
The matching rule opens INC-00001 in DESK with the device and problem details attached.
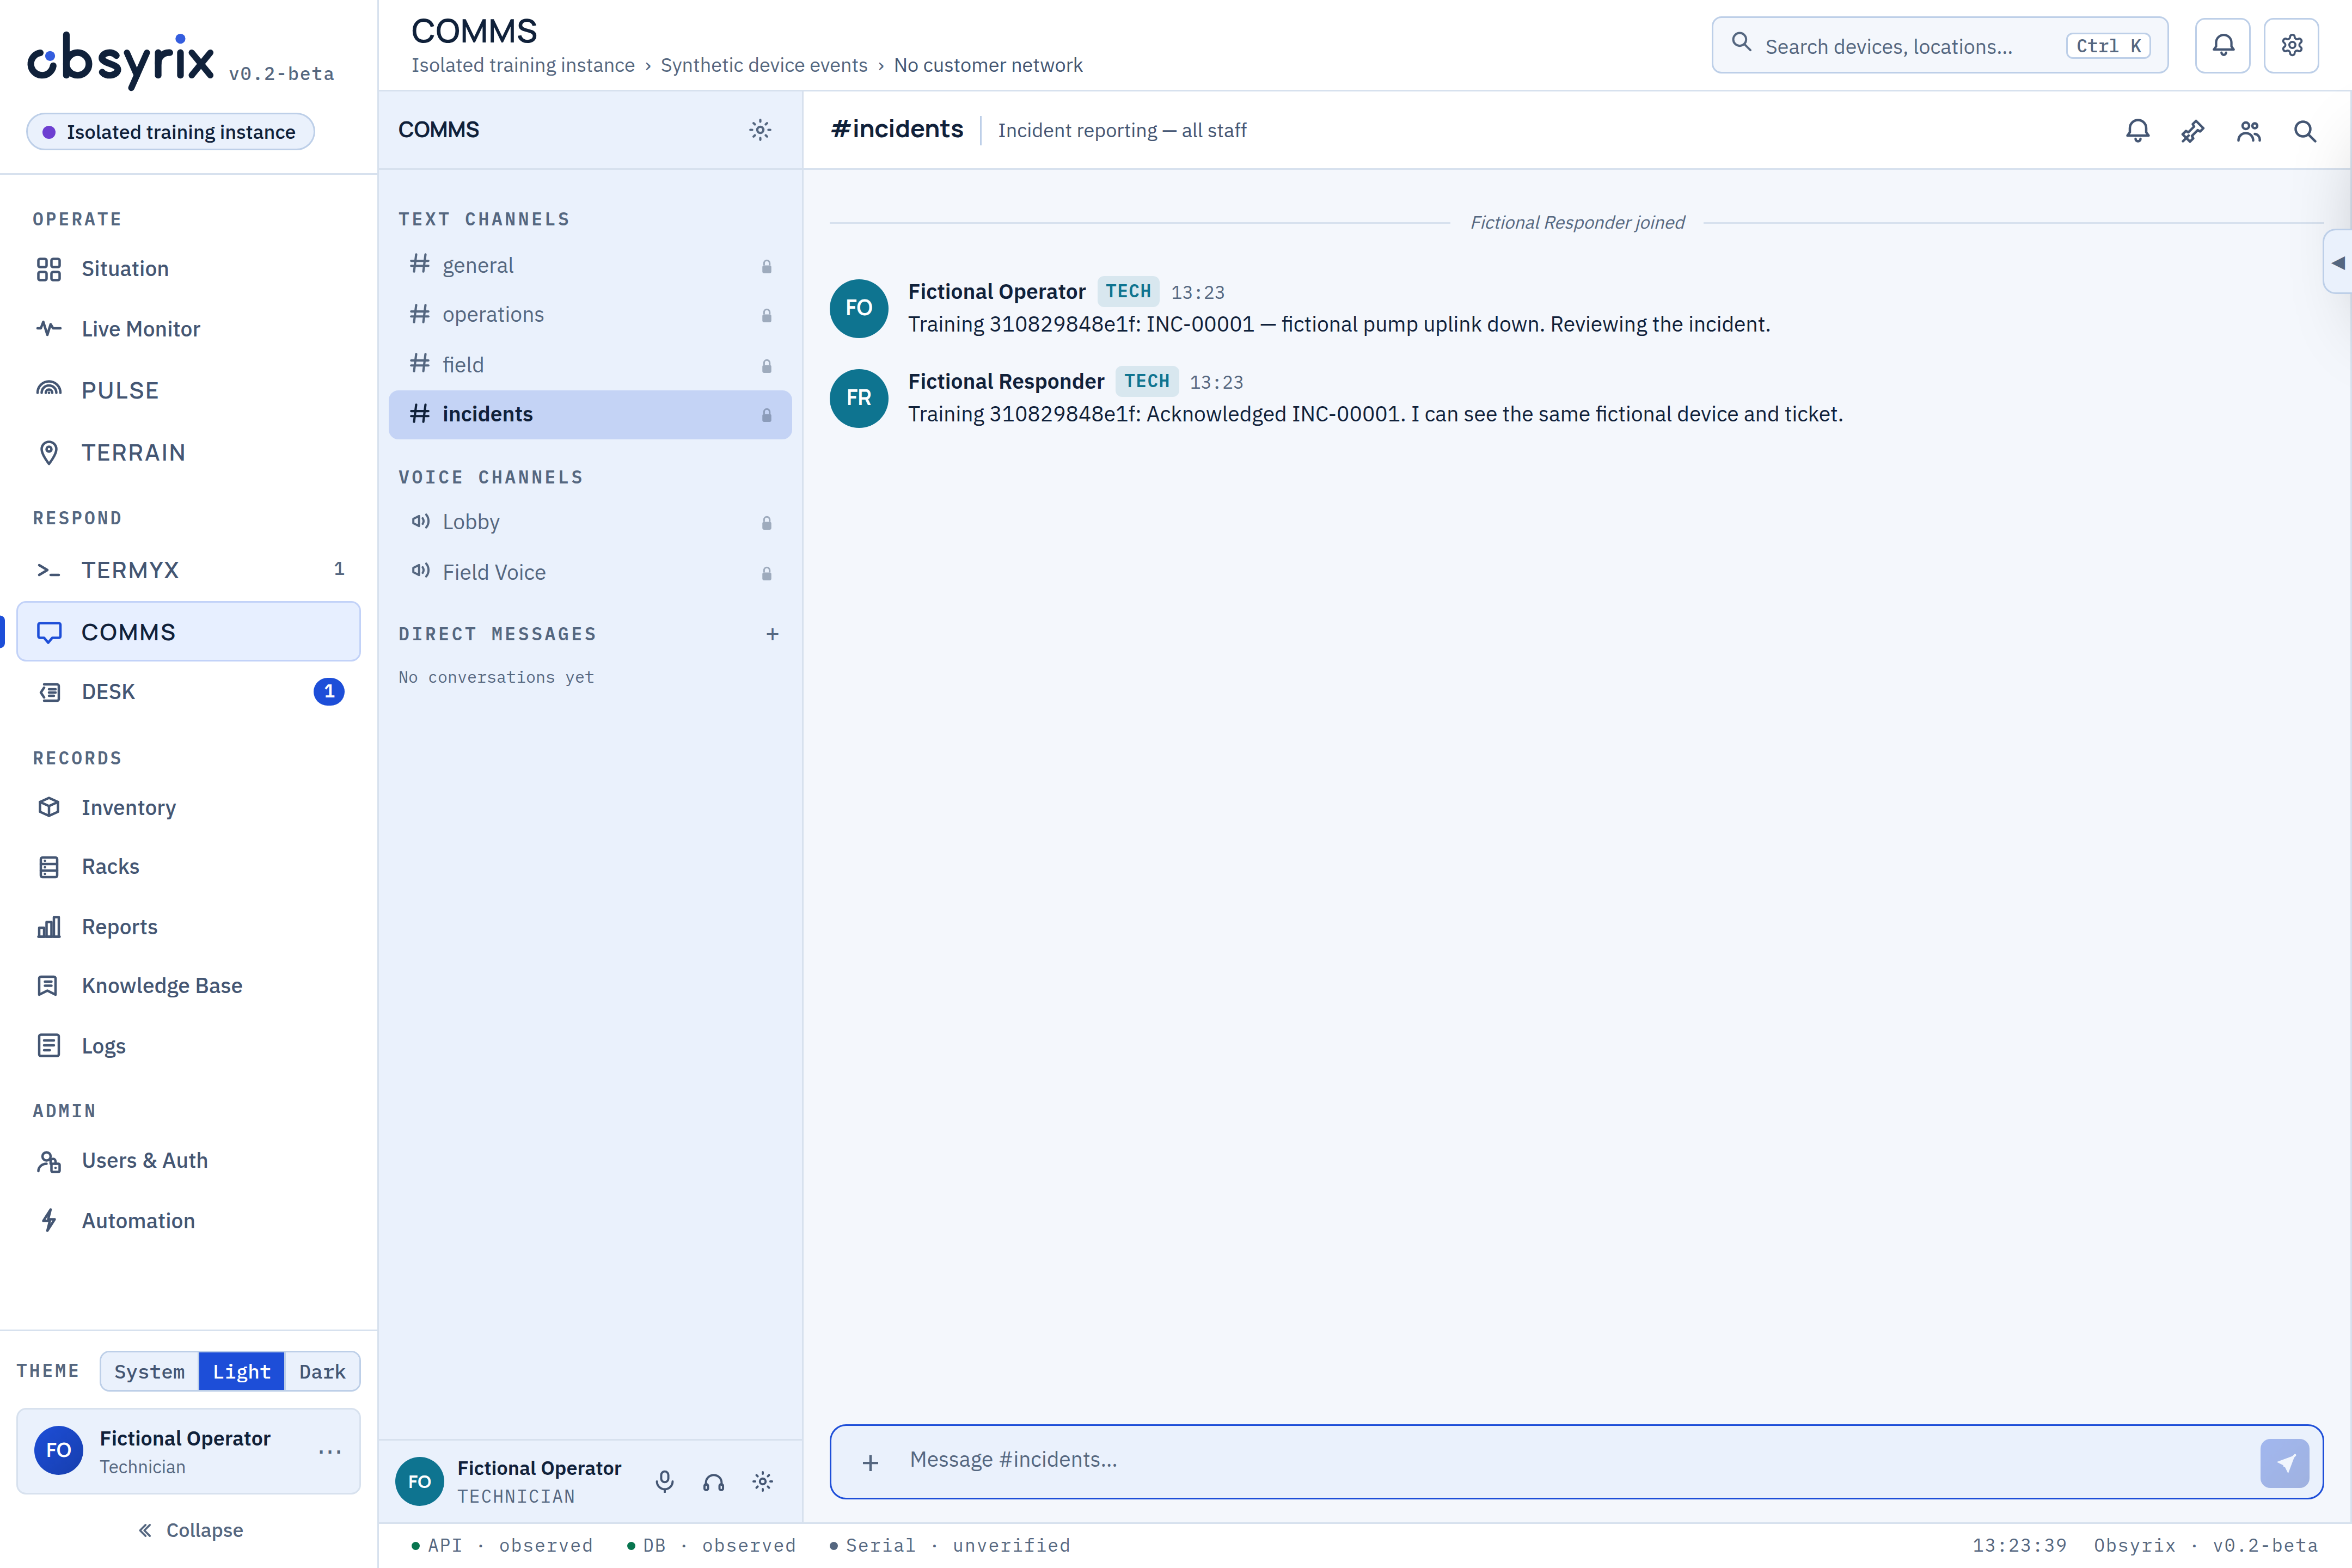
Two signed-in teammates share the incident and acknowledge it in COMMS. The conversation is theirs.
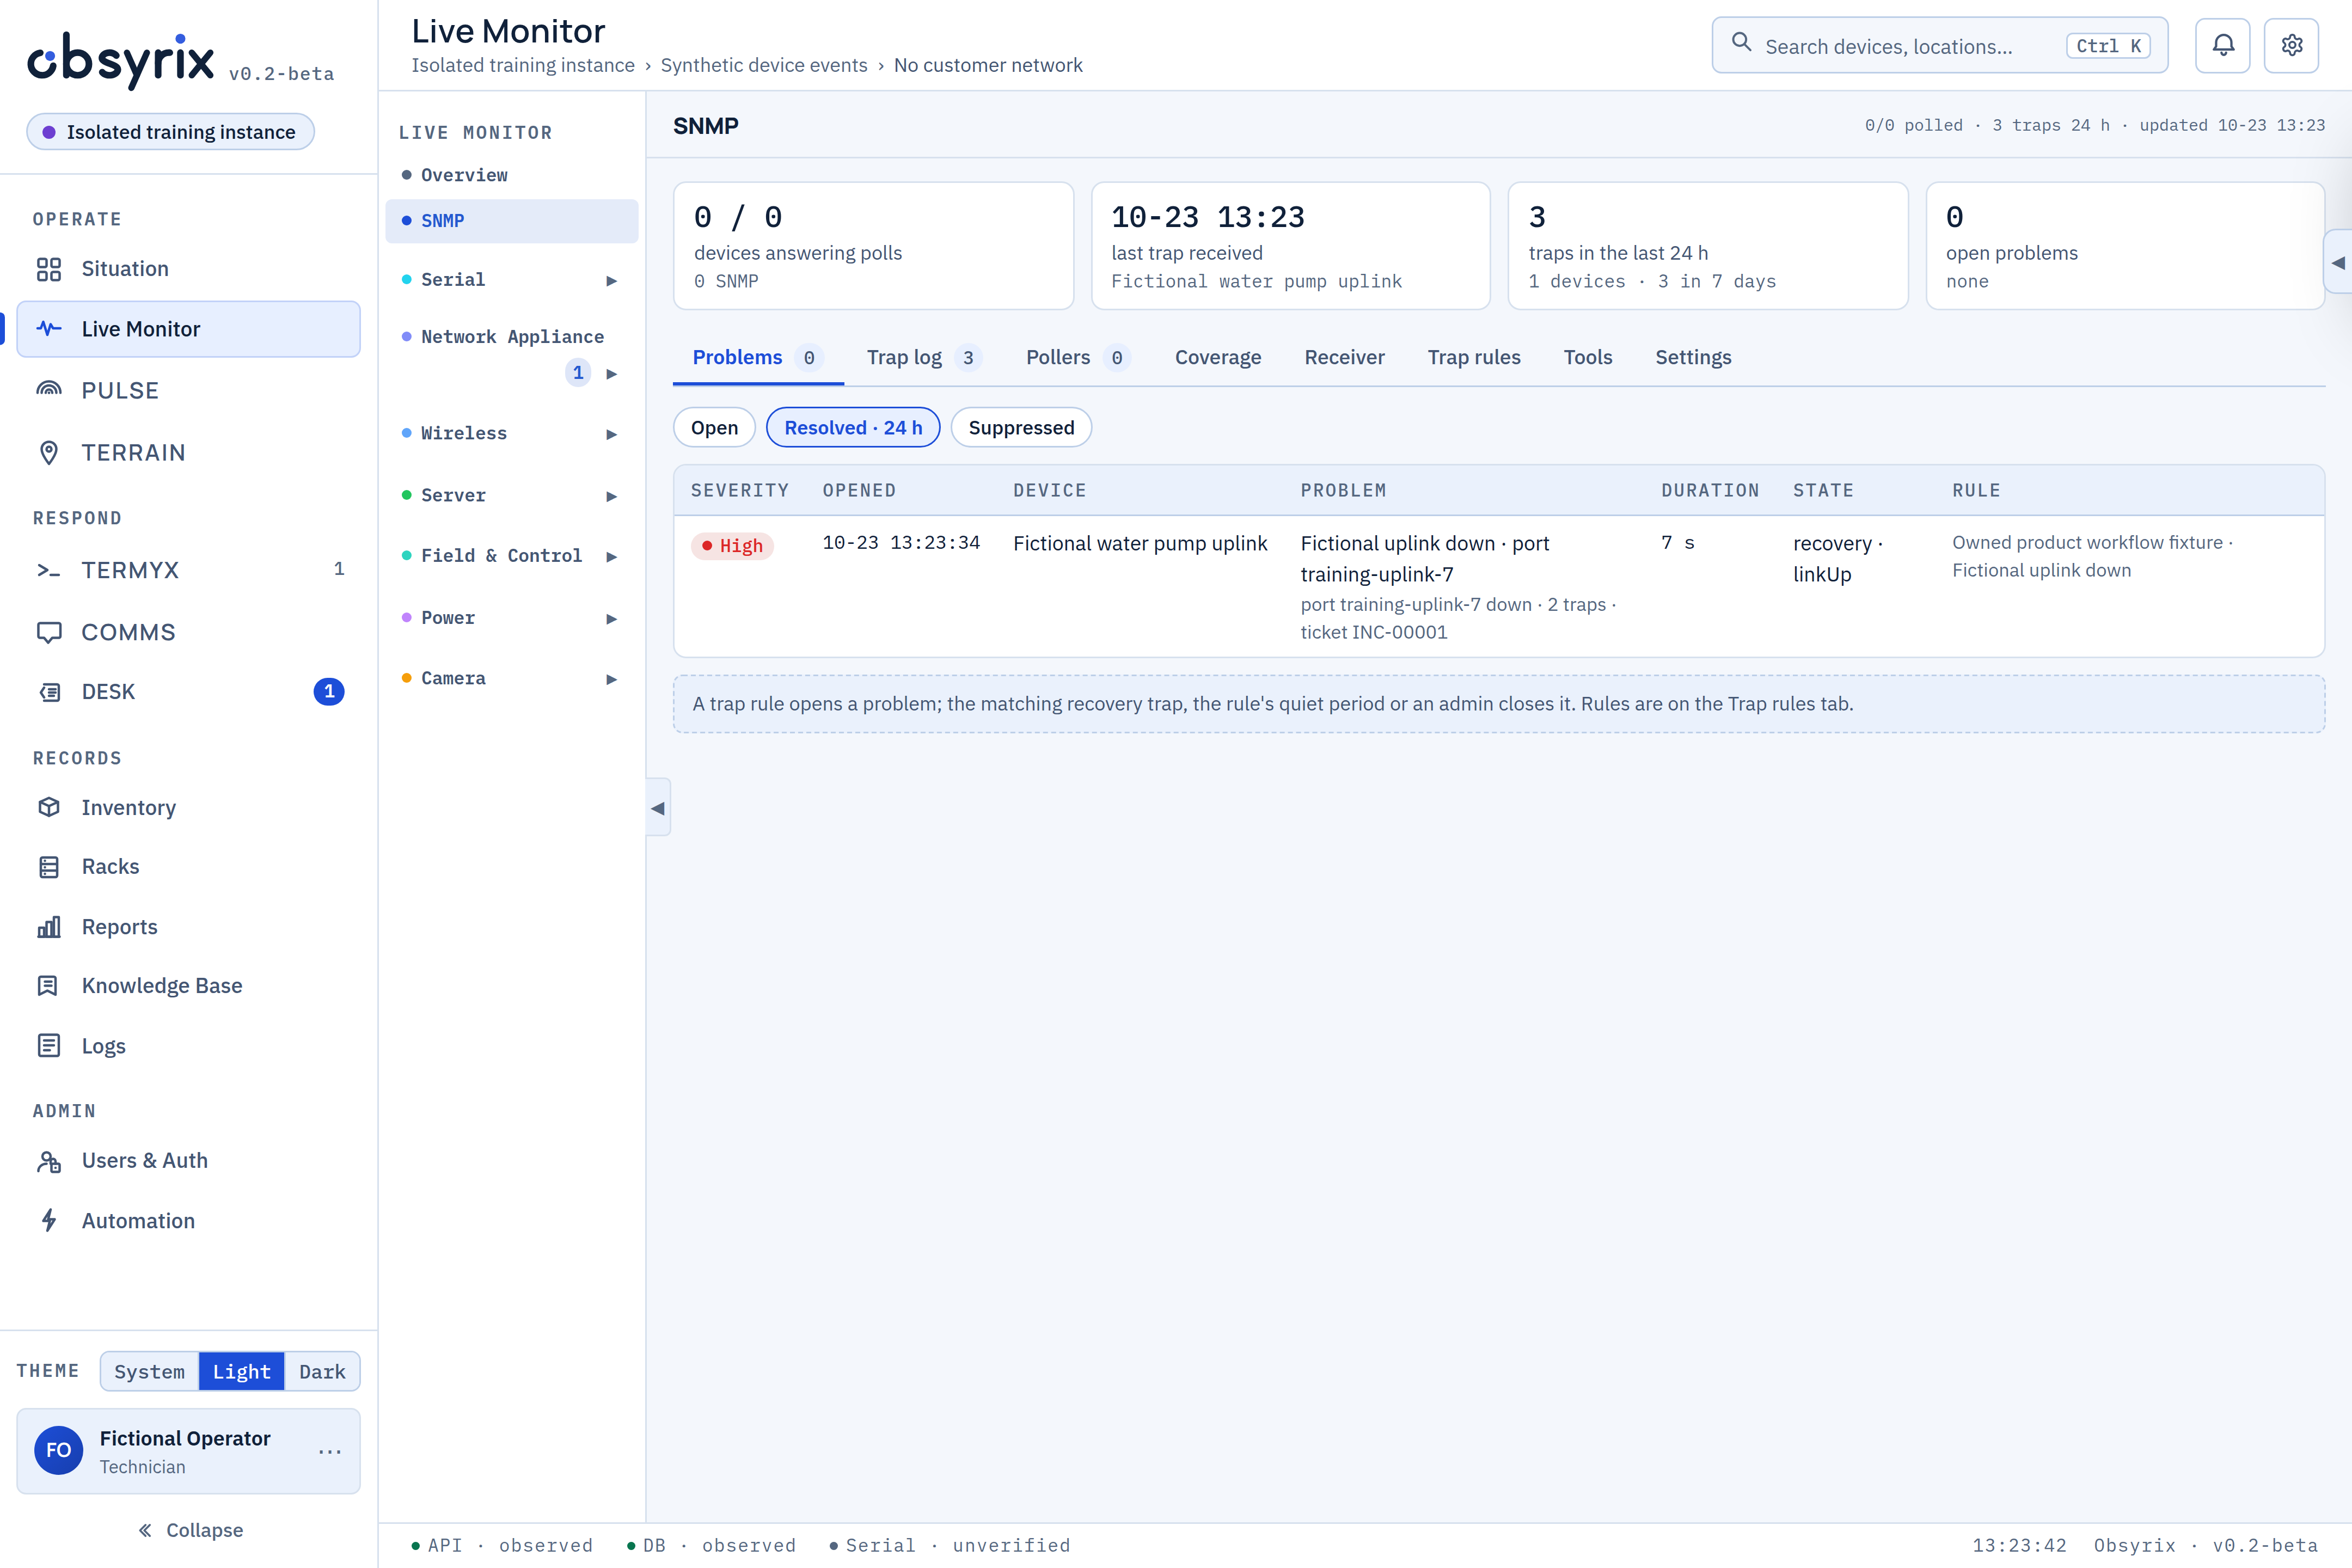
A synthetic recovery clears the SNMP problem. The ticket stays open for the team to review.
After reviewing the recovery, the operator resolves the ticket. Its activity records who made the change.
Controlled fictional demo · real product frames. The team writes the COMMS messages and resolves the ticket. The presentation guides the view; it does not run the product.
These unmodified captures come from a verified workflow in isolated training services with real sign-in, SNMP processing, DESK, COMMS and saved data. Input starts as decoded synthetic trap text, not a physical device or UDP packet. Recovery clears the alert; the ticket stays open until an operator resolves it. Chat is operator-authored. No customer network or physical equipment is involved. Crops, pointers and highlights are presentation guides.
Workflow verification notes ↗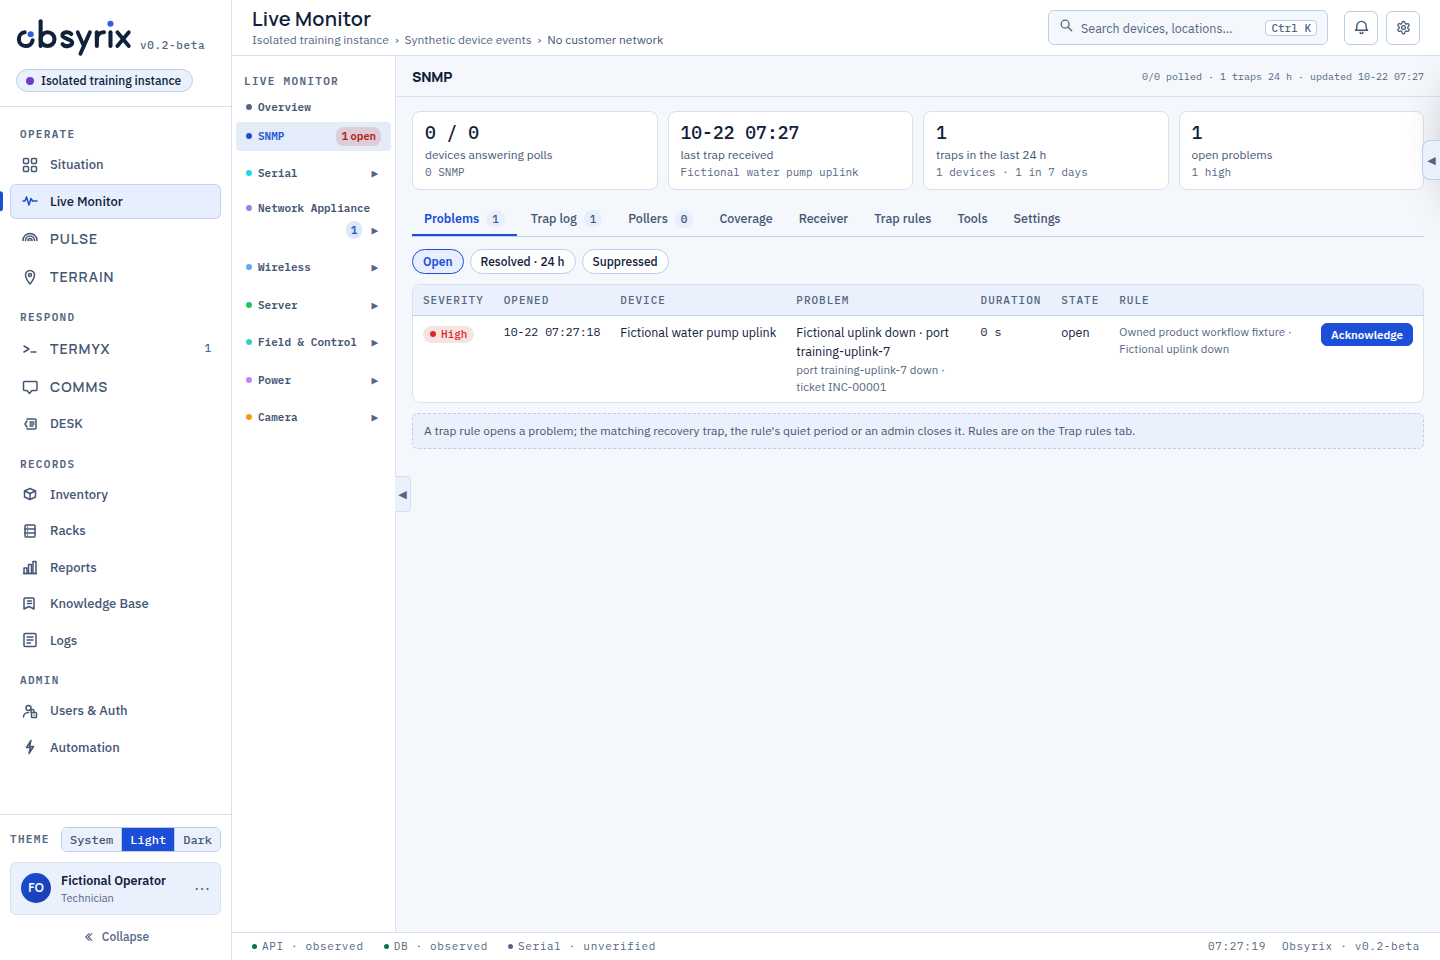
A problem creates a DESK incident. Two teammates coordinate in COMMS, review the recovery, then resolve the ticket.
A fictional uplink-down event reaches the real SNMP processor and creates INC-00001 in DESK. Two signed-in teammates exchange an incident message and acknowledgment through the actual COMMS service. A synthetic recovery clears the alert while the ticket stays open. The operator sends a recovery update and resolves the ticket; message IDs, resolution and actor history are saved in the scratch database.
Silent, normal-speed recording of real UI, authentication, HTTP and WebSocket services in an isolated training instance. No API responses are mocked. Input begins as decoded synthetic trap text, not UDP or physical equipment. Chat is operator-authored, not an automatic alert connector. Existing footer indicators do not prove gateway connectivity. This is a targeted workflow check, not an overall system-health claim.
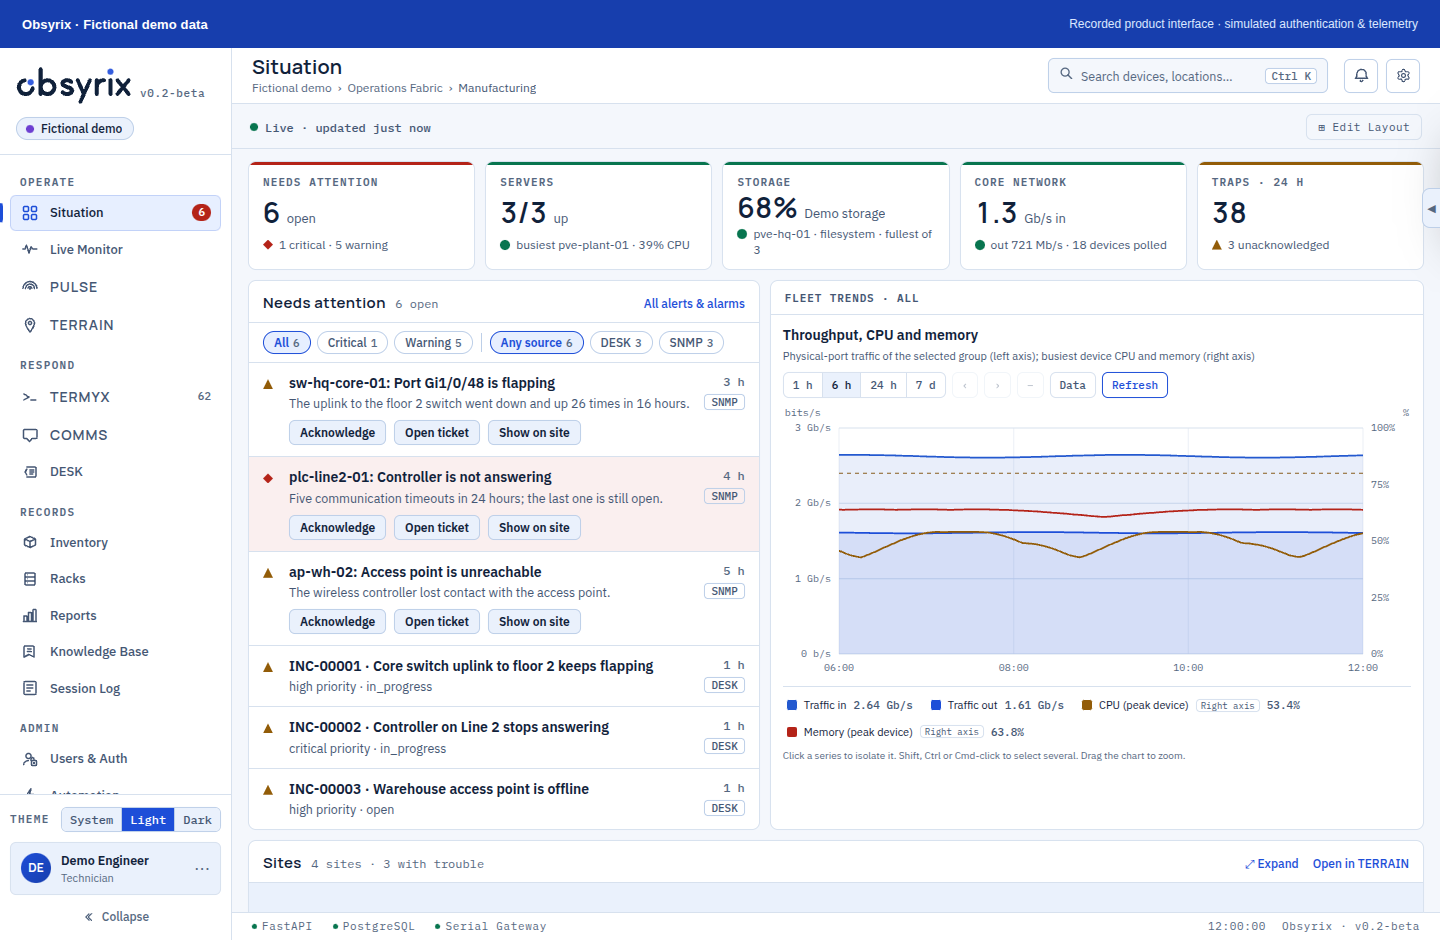
An alert, its device and the service queue share the same workspace. Fleet throughput, CPU and memory sit alongside the work.
The Situation board shows a fictional 62-device manufacturing site, six attention items and synthetic fleet trends. The layout uses the product’s saved widget preferences. No real network is monitored.
The recording is silent. Authentication and responses are simulated locally; the application markup and rendering are unchanged.
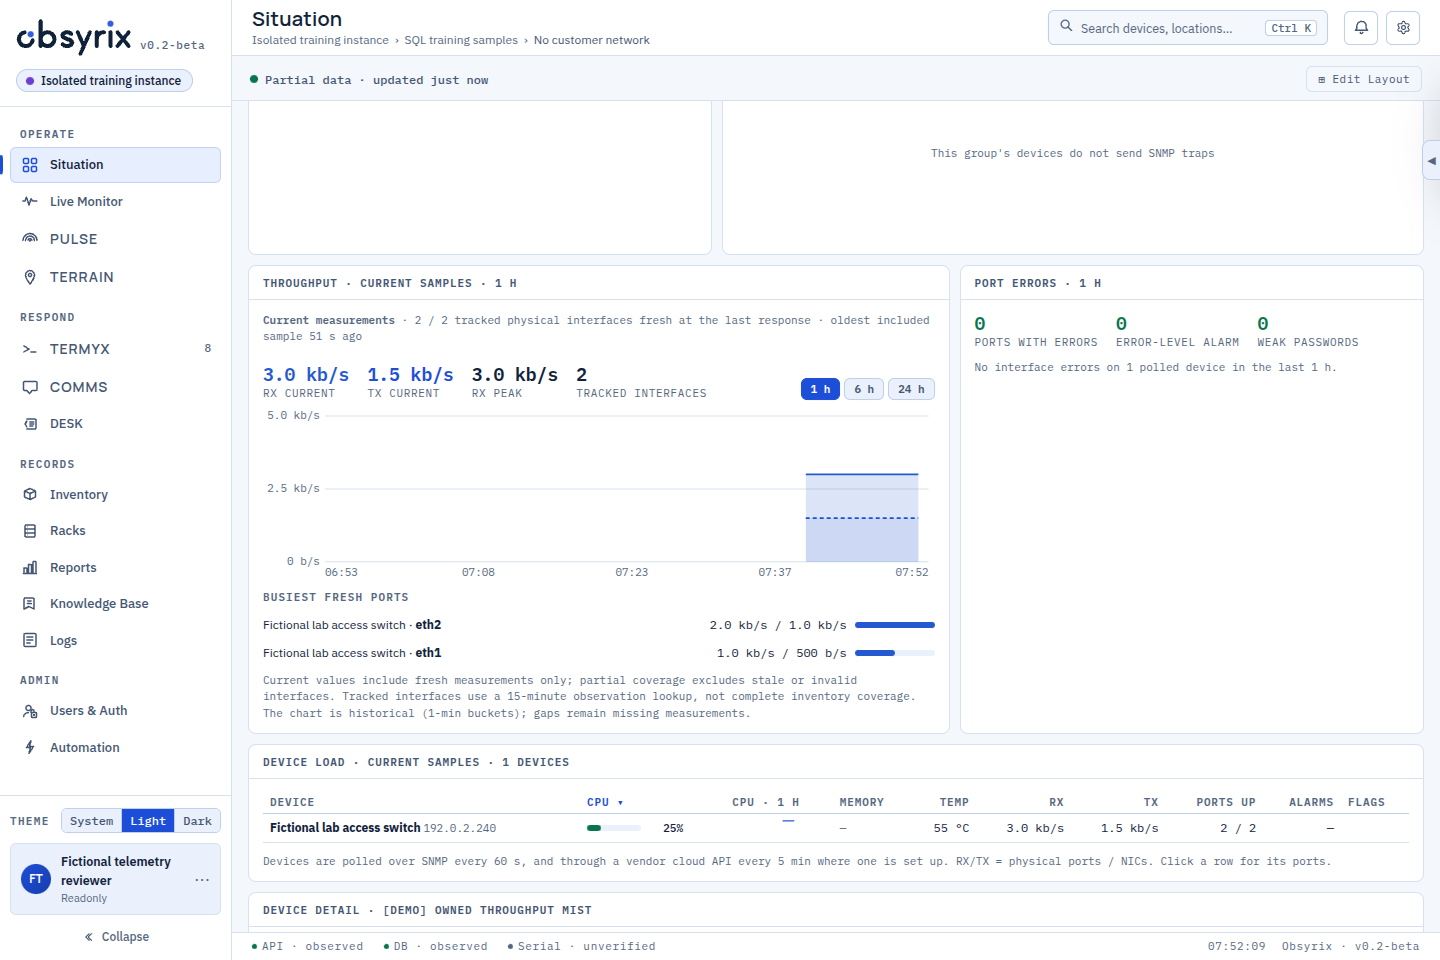
Read current traffic alongside its history. See old and missing observations stay unavailable, then watch a newly saved training sample appear.
The Throughput card opens Current samples, Historical samples and No observations in the real application. Historical chart points remain visible while old or absent measurements leave current RX/TX unavailable. An isolated QA control appends one unchanged fictional training sample at the database’s current time; the next product refresh reads that saved sample and shows it as current.
Silent, normal-speed recording with real password authentication, product API responses and PostgreSQL reads. Measurements were seeded in a disposable training database; no physical collector or customer device ran. The recovery is a fixed QA action, not a demonstrated product automation. Existing footer indicators do not establish gateway or overall service health. The current interface lookup covers the preceding 15 minutes; charts retain their historical range. Recording provenance ↗
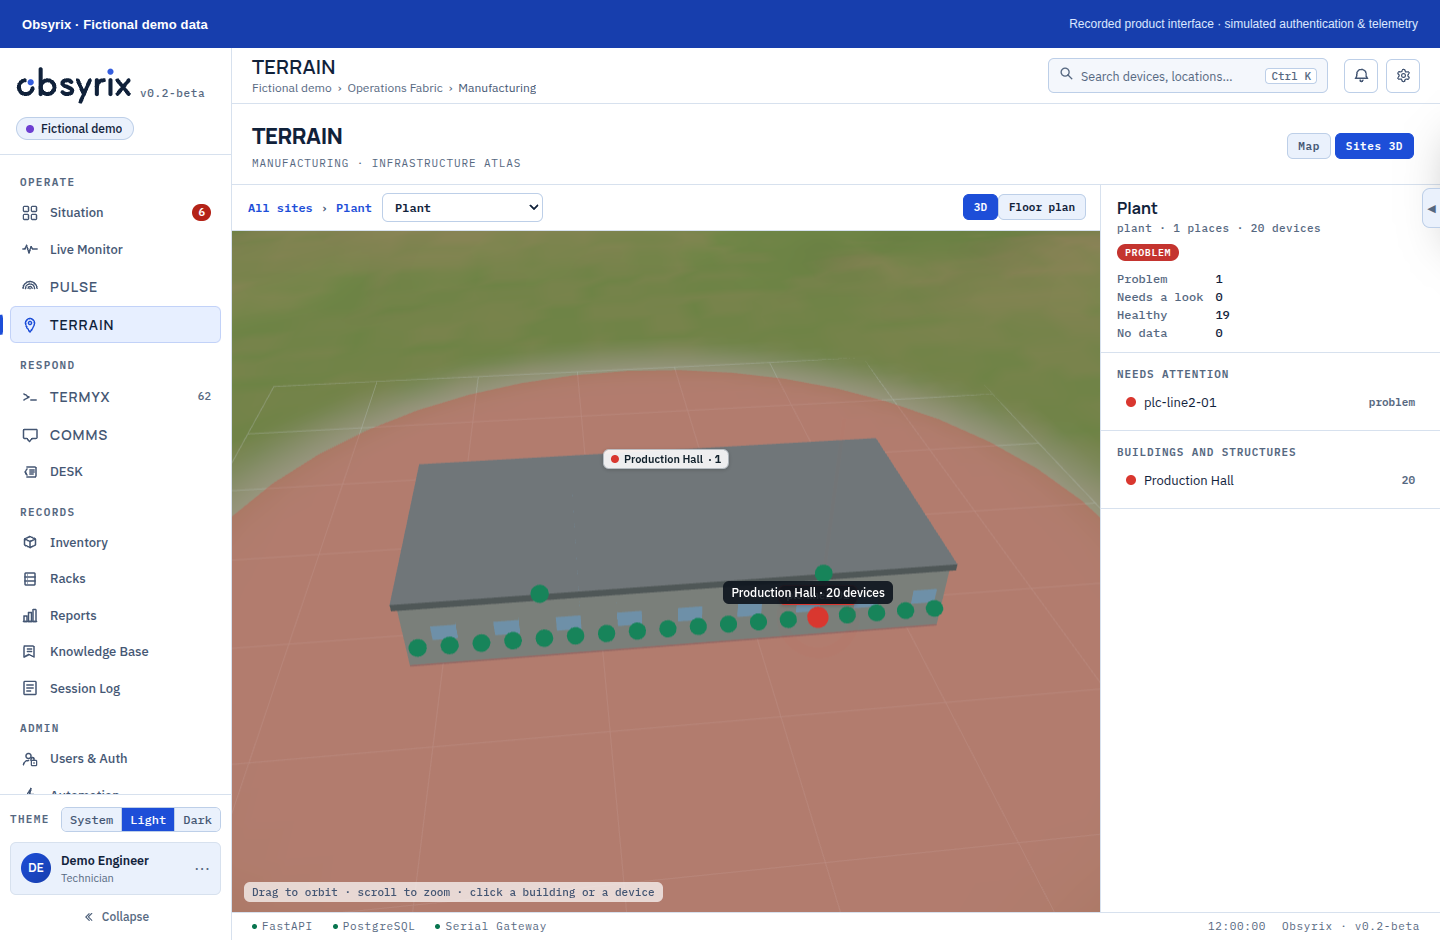
A site view brings floor placement and device relationships into the investigation. Orbit the existing product’s spatial view.
TERRAIN opens the fictional manufacturing Plant site. The recording orbits the existing product’s 3D layout generated from fixture device locations. This is a schematic, not a surveyed building or a live digital twin.
The recording is silent. Authentication and responses are simulated locally; the application markup and rendering are unchanged.
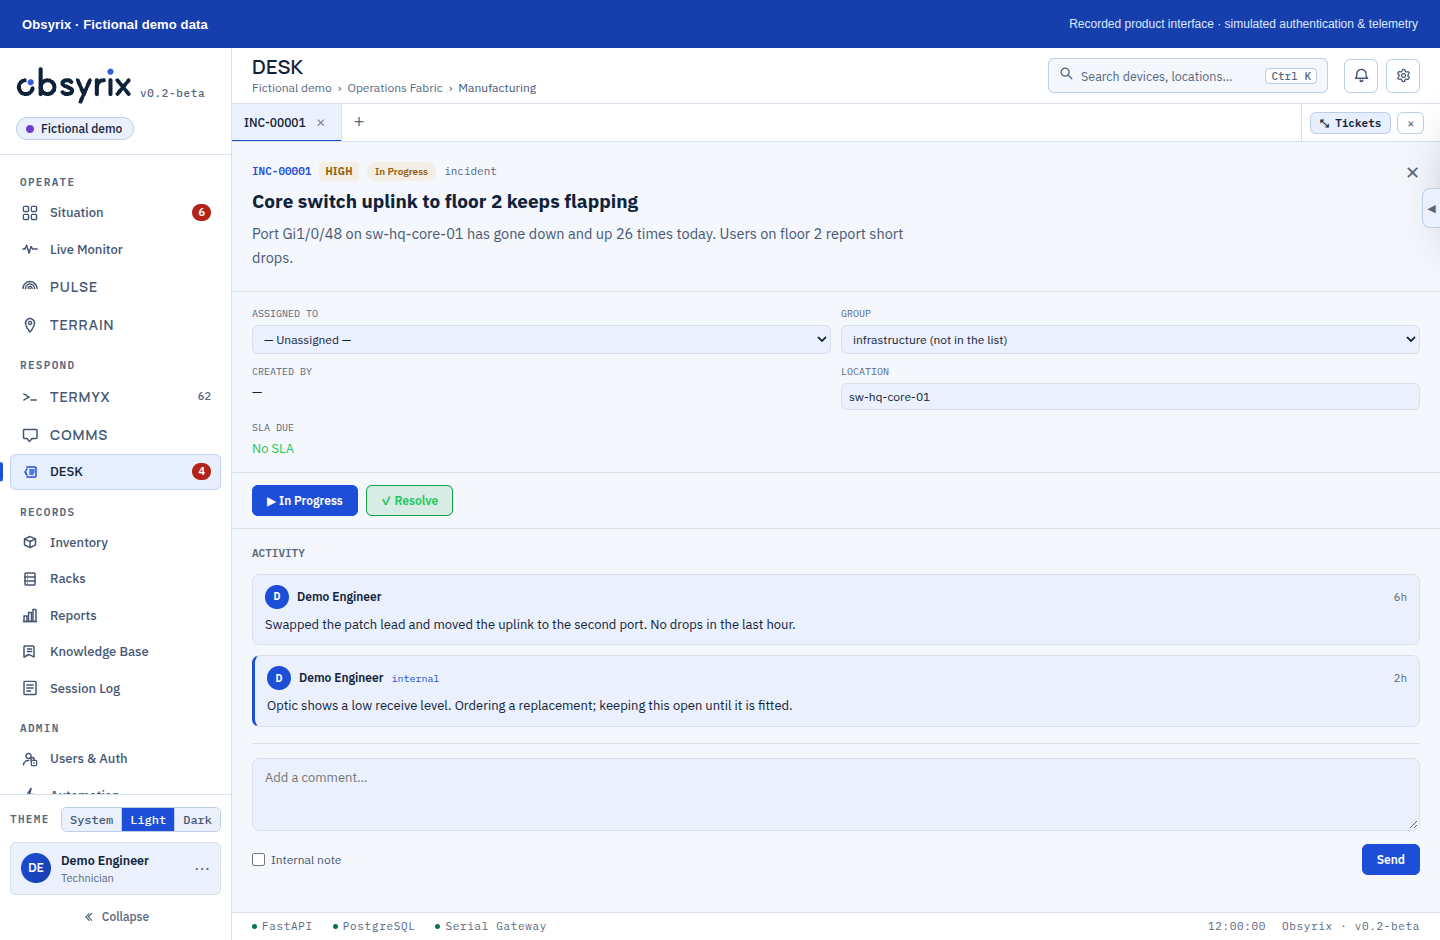
Open a prefilled ticket draft from an SNMP problem, then read an existing incident and its activity without losing context.
An SNMP problem opens a populated DESK draft. The draft is cancelled without saving. An existing fictional uplink incident is opened and expanded. No ticket is created and no customer system is contacted.
The recording is silent. Authentication and responses are simulated locally; the application markup and rendering are unchanged.
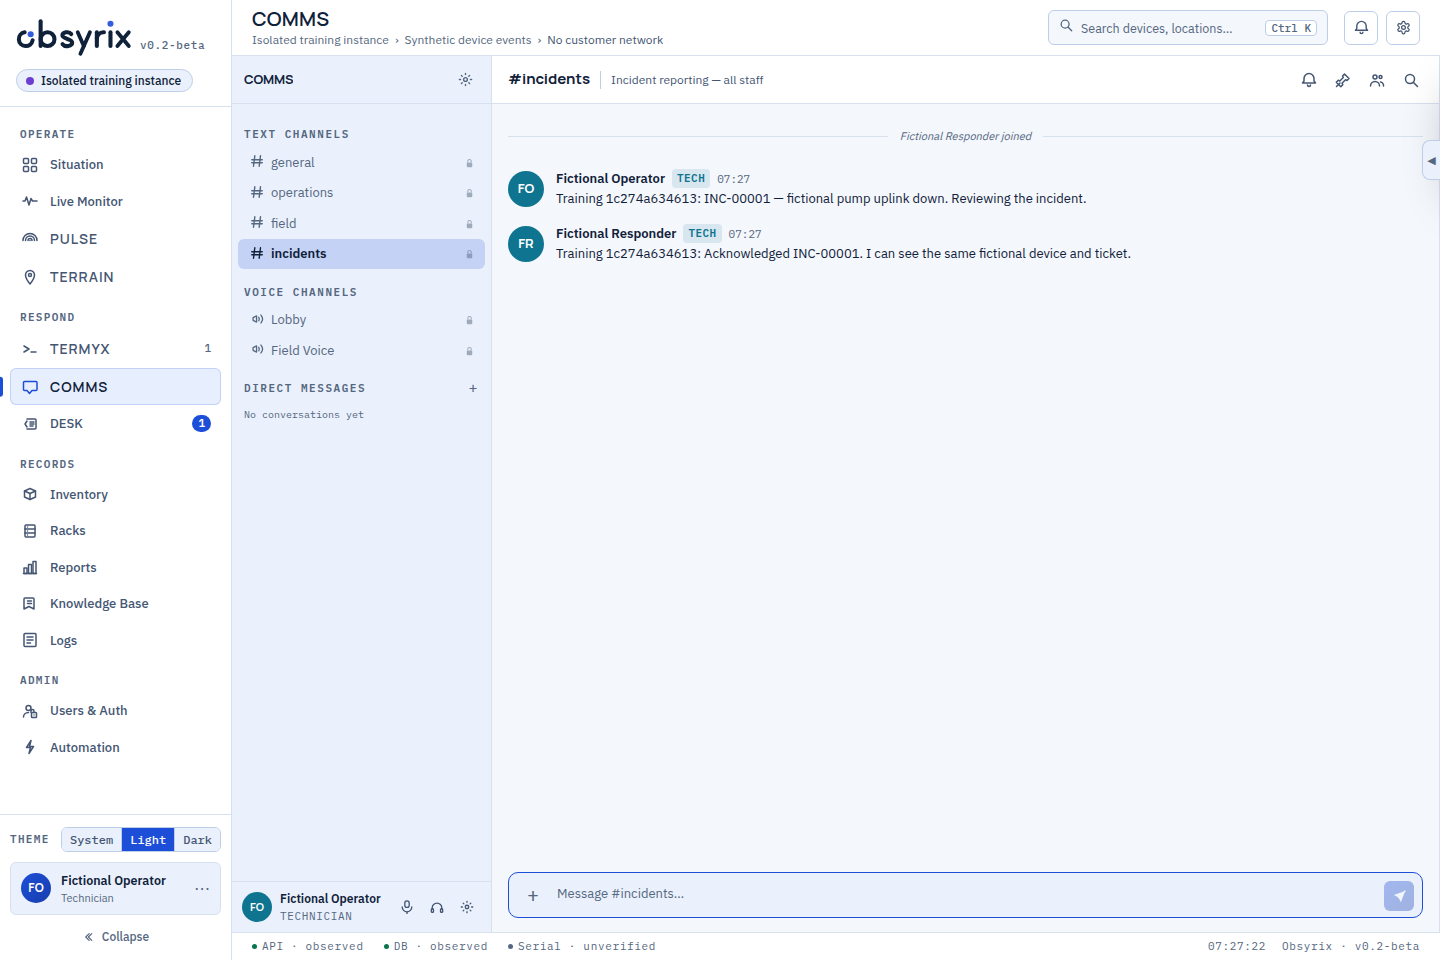
An incident message reaches a second teammate, whose acknowledgment returns through the real COMMS service.
In #incidents, Fictional Operator posts the training ticket and fictional uplink problem. Fictional Responder acknowledges the same incident. Both actual browser sessions receive the same saved message IDs through the real COMMS WebSocket service and scratch PostgreSQL database.
The silent excerpt comes from the verified incident workflow at normal speed. Accounts and device data are fictional; authentication and message delivery are real. No external chat, voice call, video call, physical equipment or customer network is involved.
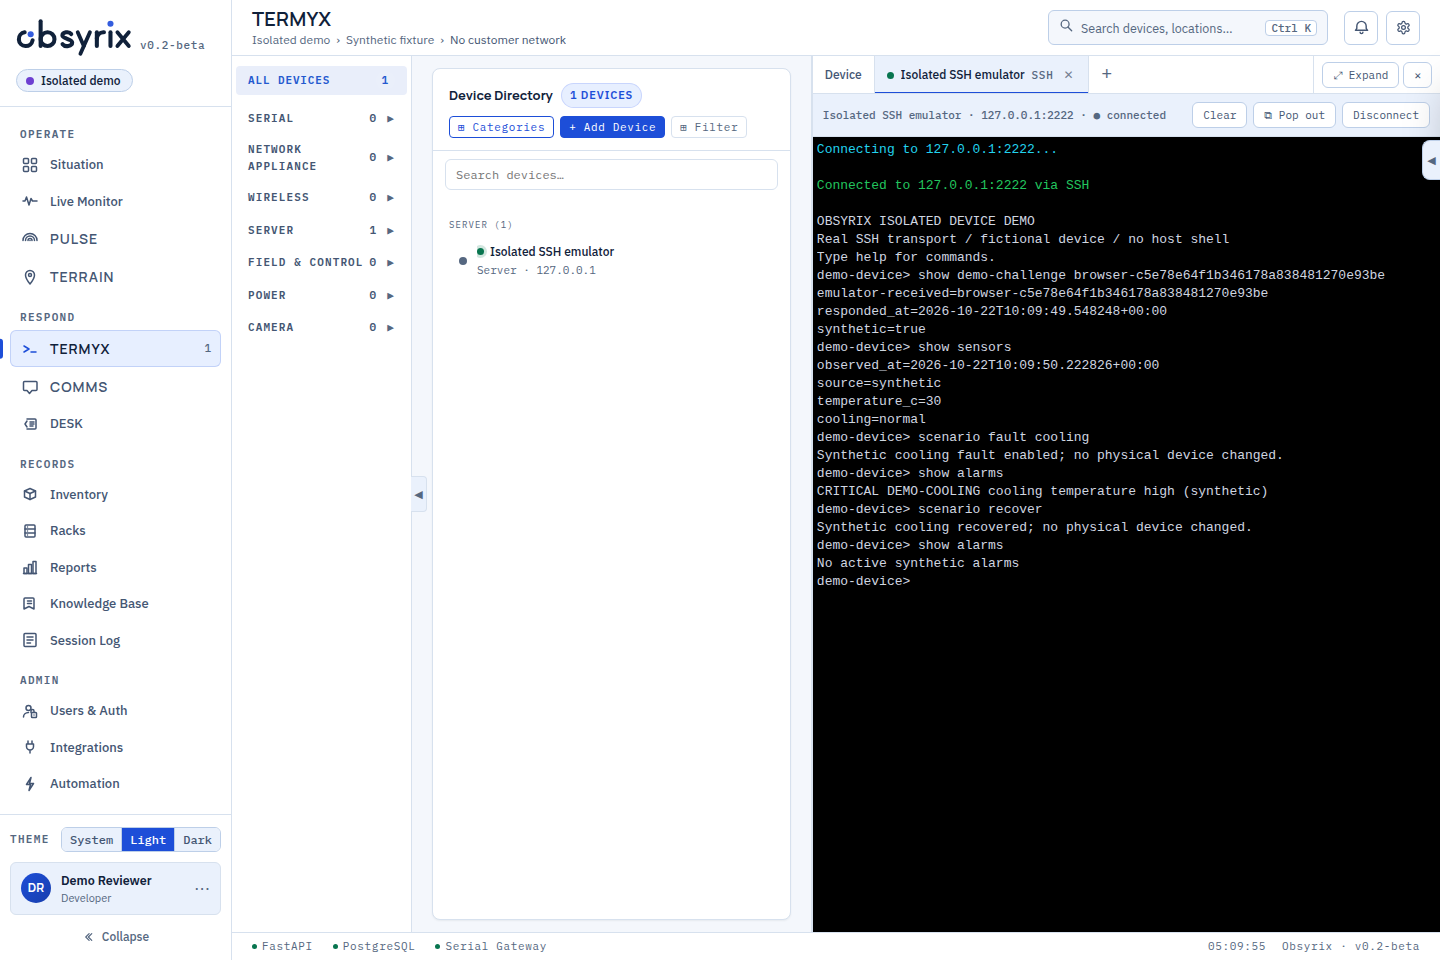
Actual TERMYX, backend and SSH transport connect to an isolated fictional device. Send a command, inspect a synthetic alarm, then watch the recovery.
TERMYX connects by SSH to the isolated demo-device emulator. A browser-typed challenge is received and echoed through the actual backend and SSH connection. “show sensors” reports synthetic temperature. A synthetic cooling fault is enabled, “show alarms” reports it, then recovery clears the alarm. The session exits.
This view uses real SSH transport, separate from the simulated API views. The device is fictional, has no host shell, and changes no physical PLC, serial hardware or customer system. Synthetic sensor values are not field measurements.
Incident workflow, Team comms and Telemetry use real authentication, services and saved data in isolated training instances. Telemetry measurements are fictional database samples; no physical collector ran. Situation, Sites & 3D and Service desk are the three earlier rendering fixtures with simulated responses. Real SSH transport uses an isolated fictional device. All device inputs are synthetic; no customer system is contacted.
Choose an industry, find an asset on the map and open its 3D surroundings. Inspect example readings, trace relationships and explore a training incident.
Field teams juggle a serial terminal, an RDP client, an SSH client, an SNMP poller and a spreadsheet of IP addresses. Obsyrix keeps the inventory and the sessions in one place, with the same login for all of it.
Pick a device and its session opens in a tab. Keep several open, expand one to full width, or pop it out into its own window. It works on a phone too, and installs like an app.
Every module reads from the same device directory, so a switch you add once shows up in discovery, monitoring, the map and the session broker.
The home screen opens on the problems worth your time, with the weather, a network map and fleet trends beside them. Arrange it your way: move, resize or hide any block, expand the map to the full window, and pick one of ten colour palettes in light or dark.
Categories and subcategories you define, with every way to reach a device kept alongside it.
Serial, SSH, RDP and VNC side by side, with no client software on the technician's machine.
A wall view for the operations floor: device health, throughput, SNMP alarms and recorded advisories.
Scheduled discovery sweeps with a changelog, so a device that appears or goes quiet gets noticed. Neighbours found over LLDP are drawn as a map: routers and firewalls at the edge, switches below, every other host grouped by subnet.
Lay assets over a corridor, campus or floor plan and see warnings by location before you open a session.
Chat, voice and video between the operations floor and the field, next to the device you're both looking at.
Tickets with a priority, an SLA and an owner, opened by hand or from an SNMP problem and kept next to the device they are about. Open several tickets side by side in tabs, or expand one to read it in full. Automated first-line diagnostics are in the delivery backlog and are not part of this demo.
Implemented access paths depend on supported endpoints and deployment configuration. Industrial adapters marked backlog are unavailable in this release.
| Protocol | Used for | Status |
|---|---|---|
| Access | ||
| RS-232 serial | Controllers and RTUs behind serial device servers, opened as a browser terminal | Implemented |
| SSH | Switches, routers, firewalls, radios, Linux hosts | Implemented |
| Telnet | Older gear that never got SSH | Implemented |
| RDP · VNC | Windows HMIs, engineering workstations, vendor consoles | Implemented |
| Monitoring | ||
| SNMP v2c / v3 | Polling for health, interface throughput and port state | Implemented |
| SNMP traps | Alarms pushed from devices, matched to the directory, on udp/162 | Implemented |
| Network discovery | Scheduled sweeps across the subnets you choose | Implemented |
| LLDP | Who is plugged into what, drawn as a map | Implemented |
| Industrial telemetry | ||
| Modbus TCP | PLCs, meters, drives | Backlog |
| DNP3 | Water, wastewater and electric RTUs | Backlog |
| OPC UA | Plant-floor controllers and historians | Backlog |
| MQTT · Sparkplug B | Sensors and IoT telemetry | Backlog |
| RTSP · ONVIF | Cameras and thermal imaging | Backlog |
Longer-term research for Obsyrix. These modules are not available in the current beta, have no committed release date, and are separate from the integration delivery backlog.
Native collection, investigation and correlation of security events alongside the site, device and service history.
Research into native detection and response, with scoped actions, evidence and operator approval connected to the same workspace.
Research into native device enrollment and policy management, with lifecycle visibility and controlled changes.
Obsyrix installs on one server at your site. The core runs on premises. You choose which external integrations and services to enable.
# what runs at your site
one server         # a VM or a box you already own
  web console      # every module, in the browser
  device directory # stays on your server
  session broker   # serial, SSH, Telnet, RDP, VNC
  discovery        # sweeps you schedule
  monitoring       # polling, traps, alert rules
  team messaging   # chat, voice, video

# open to your network
  HTTPS            # the console, one port
  SNMP traps in    # only if devices send them
Runs on a server or VM you already have. Releases are versioned. Operator-led updates use reviewed backups, isolated validation and an explicit rollback plan.
Run it on a pair of hypervisor nodes with replication and failover, or on a single VM for a small site. The software is the same either way.
The serial module is an add-on for sites with RS-232 field gear. Sites without it never install it.
IT management tools are built for Windows fleets. Obsyrix is built for distributed field equipment: long-lived, mixed-vendor, and often still on a serial port. Bring whatever brands you run.
wayside controllers · RTUs · event recorders · serial multiplexers
lift stations · PLCs · DNP3 RTUs · flow meters
substation RTUs · relays · industrial Ethernet switches
PLCs · HMIs · drives · historians · plant-floor switches
turbine controllers · inverters · remote stations · data loggers
towers · backhaul radios · edge routers · cabinets
servers · network appliances · console servers · UPS systems
branch networks · switches · servers · workstations
depot networks · dispatch workstations · radio gateways
facility networks · servers · UPS systems · building-system gateways
We're taking on a small number of beta sites. Tell us what you run and roughly how many devices you have through your customer portal. We'll review deployment fit and post the next step there.
Questions about joining the beta? Email [email protected].
Applications are saved privately after sign-in and submission. Creating an account alone does not grant downloads, a licence or a production-service commitment.
Prefer to ask a question first? Email [email protected].